Mapping a value from one scale to another is one of the principle operations that is done constantly in computer graphics, but also in maths and everyday problem solving.
This page is describing two simple equations that are so useful that they are an excellent way to start children applying maths to the real world.
Real-world maths usually involve playing with numbers that have units (inches, millimetres, elephants) etc.
If a lot of playing is to be done, the maths can be made easier by working without the units, and people do that a lot naturally, for example, by expressing numbers as percentages.
Knowing which units a number has is crucial when working out anything.
Instead of the percentage range from zero to a hundred inclusive (written as [0,100]%), there are advantages to using a "per-unit" range [0,1] which allows easy conversion (mapping/scaling) with simple maths.
The range is called an Unsigned Unit Interval [0,1], A Signed Unit Interval [-1,1] is also useful if your scale has zero in the middle.
Writing [-1,1] means the range of numbers between -1 and +1 including -1 and +1; so -1.5 and zero are both in that range, but 2 is not.
Maths also uses parentheses () to describe a range that doesn't include the number shown, for example [0,1) looks like a typo, but means the range starts at and includes zero and goes all the way up to 1, but does not include one; so the largest number in that range is 0.9999999... but not 1!
Values that are in the range are called 'parameters' (awfully ambiguous) and favourite variable names for a parameter tend to be s,t,u and v (t will be used in this site).
Finding the range of numbers you are starting with, is simply a case of subtracting the smallest number in your scale from the largest number.
A range is a journey from the start of the scale to the end, in the same way as a 2D or 3D vector in graphics is a journey from one point in space to another: range is a 1D vector.
Unit Intervals are one dimensional Unit Vectors.
The start point of the journey is the smallest number in the scale.
Whether you should use Signed or Unsigned depends on whether your value has a zero mid-point (use Signed) or whether you will be adding or multiplying a lot of values.
If adding lots of random values, Signed Intervals will tend to stay around zero.
When adding Signed Unit Intervals, simply take the mean average: (t1+t2)/2 or (t1+t2+t3)/3 etc.
Imagine multiplying two Unsigned Unit Intervals: the smallest result will happen when multiplying the lowest numbers in the range: 0*0 which is 0... and the largest will be 1*1 which is 1... in other words, the result of a multiplication of Unsigned Unit Intervals is another Unsigned Unit Interval.
 This is one of the most valuable principles in maths (the basis for Procedural Textures and Fuzzy Logic, for example): remember and use it as often as possible!
Note that when multiplying many Unsigned Normalised Intervals the product can only get smaller or, if one of the numbers is 1, stay the same.
In graphics terms, if greyscale levels or colour components (Red,Green,Blue) are in the range [0,1], mixing two shades is a simple multiplication.
If you are familiar with Vectors, you will know that Normalizing a vector means making its length one unit without changing the vector's direction; it reduces a 'journey' to something which only indicates direction.
Unit Vectors are valuable because you can use them to specify any journey in that direction by multiplying to stretch them to the required length, and adding the result to a point sets the beginning of the journey.
In the same way, when using Normalized Unit Intervals, you simply scale them up to the required units after you've finished playing with them with a simple multiplication and position them in the original range with an addition.
The following image shows a number line with the range for Signed Unit Interval marked in Blue, and Unsigned Unit Interval in Red:
If you had a value in an Unsigned Unit Interval, such as 0.5, and wanted to convert it to a Signed Unit Interval, here's how you do it (this is an example of mapping):
An Unsigned Unit Interval has a range of 1 (range is maximum value - minimum value: in this case 1-0 = 1).
A Signed Unit Interval has a range of 2 (because 1 - -1 =2 but it is more obvious when looking at the number line above).
So the first thing to do to get a value from an Unsigned to a Signed Unit Interval is to double the range. This means multiply the value by 2, which will result in the orange range [0,2] (because 2*[0,1]=[0,2] i.e. 2*0=0 and 2*1=2).
Now the range is correct, but the origin needs to move to the left one unit: so all that is left is to subtract 1 and the orange range slides left to the blue range.
So Signed(t)=2t-1;
To get from a Signed Unit Interval to Unsigned, simply reverse the process: add one to t and divide everything by 2:
So Unsigned(t)=(t+1)/2;
Global.h has a couple of templates for mapping from signed to unsigned and back:
template<typename T> T Unsigned(T t) {return (t+1)/2;}
template<typename T> T Signed(T t) {return 2*t-1;}
Mapping numbers from one scale to another is a common maths problem. Often the problem becomes far simpler if the ranges are turned into Unit Intervals as shown in the next example.
The following image shows parallel lines (representing different linear scales) positioned so that their middles line up:
Their end points can be joined with light green lines to a focus point.
An Unsigned Unit Interval will be another parallel line with a length of one, positioned so that its ends touch the green lines too.
Now pick any point on the big scale and draw a line to the focus point and the normalised value will be where that line crosses the Unsigned Unit Interval line.
Once you have a Normalised value, you can play with it without worrying about the scale.
As a result, there are many 'black boxes' in gFilters, for example, which take and return Normalised Intervals.
gColor uses them a lot for smoothing colour-changes and converting from different colour systems (RGB-HSL-HSV).
As a simple example, take the middle scale's number 12. We can see that it is three-quarters of the way along the scale, so the a line from the 12 to the focus point will pass through 0.75 on the Unsigned Unit Interval scale.
The equation to get this value (which will be called 't') mathematically, needs the left and right end values (which will be called 'a' and 'b') the number to convert to an Unsigned Unit Interval (which will be called 'x').
The range of values will be b-a. For the middle scale, this is 14-6 which is 8. That is the scaling number. The value of 'a' (in this case, 6) is the base number.
To get from the Parameter t=0.75 to the number x=12, scale the parameter up to the range (b-a)t = (14-6)*0.75 = 8*3/4 = 2*3 = 6. Add this value to the base value, 6+6=12.
The resulting formula for the process is x=(b-a)t+a;
Those brought up with 'y=mx+c' will recognise this as the same shape.
To go from the value 12 to the parameter 0.75: take 6 away from 12 to find how far from the base we are, then divide the answer by the range to Normalise the result:
t=(x-a)/(b-a)
If you need a puzzle to solve to help get your head around what is going on, try using the top scale which has a negative range: start with the number 24 and find the parameter (should be 0.25) then use that to look up the value for 0.25 on the middle scale to get the answer 8.
You don't need to go to a parameter to go from one scale to another unless you need to play with the value in some way, usually to smoothly distort the data.
These two equations are available as another pair of simple templates in Global.h:
template<typename T> double Parameterize(T x, T a, T b) {ASSERT(a!=b); return double(x-a)/(b-a);}
template<typename T> T Interpolate(double t, T a, T b) {return T(a+(b-a)*t);}
template<typename T> T Map(double t, T aFrom, T bFrom, T aTo, T bTo) {return Interpolate(Parameterize(x,aFrom,bFrom),aTo,bTo);}
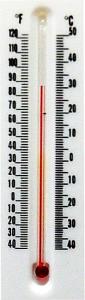
These functions both work on unsigned parameters [0,1]. To see how they work, imagine the temperature scales, Centigrade and Fahrenheit.
Centigrade goes from 0 when water freezes, to 100 when water boils.
Fahrenheit is proportional to the centigrade scale but is 32 when water freezes and 212 when it boils.
Since Centigrade is trivial to map to (just multiply the parameter by 100) going between the two scales can be demonstrate easily, rather than between one and a parameter.
If room temperature is about 25 Centigrade, that is 0.25 up the scale. To find that in Fahrenheit would need Interpolate(0.25, 32, 212); which would calculate: (32+(212-32)*0.25 giving 77 Fahrenheit.
This particular example can extend beyond the provided limits, so the parameter, t, can have any value and will return a Fahrenheit scale value (the accuracy may decline if the minimum and maximum are close together and the parameter is huge).
If you wanted to find out how far up the scale 50 Fahrenheit was, just use Parameterize(50, 32.0, 212.0); which would calculate: (50-32)/(212-32.0) which is 18/180.0 giving 0.1 or 10 Centigrade.
The Arduino SKD, for example, offers a Map function.
To map a number from one scale to another can be done like this: NewValue=Interpolate(Parameterize(OldValue, OldMinimum,OldMaximum), NewMinimum,NewMaximum);
This may look complex but can be made easier to understand if you think of using a graph:
The axes on this temperature graph are deliberately drawn with different scales (which won't matter for this linear case).
The gradient (slope) of the blue line defines how X values (along the bottom axis) map to Y values (along the vertical axis).
The red lines could indicate minimum and maximum values and the green line, some value of X which shoots up from the X-axis, hits the blue line and then travels to the Y-axis to give the new Y value.
So to map 60°C to Fahrenheit use Map(60, 10,100, 50,212);
Now you know how the Interpolate function allows you to change from a parameter to a value from a scale, but not why it is called 'Interpolate'.
Interpolating is calculating an unknown value between two known values.
If you imagine that the places where the red lines hit the blue line are two points, the blue line is drawn between the points and finding where points exist on the line using X values.
Because the blue line is straight (linear) this process is called "Linear Interpolation".
Things get more interesting when the blue line is curved, but the principle remains the same: a function is called with a parameter,minimum and maximum and returns a value.
Find out more in the Interpolation section.
Quantized Serialization (saving doubles as integers)
Another use of mapping is the lossy compression (quantization) of data when saving to files.
Imagine a three dimensional model of a human, made up of millions of triangles and/or quads (common in the marble statue industry and computer games); each triangle needs its points to be saved - but how accurately?
Saving absolute float or double-precision coordinates for each vertex is obvious, but it is also possible to think in terms of mapped ranges for each axis.
For example, 0 could be the front-most part (toe-nails) and 1 could be the furthest back part (shoulders or bottom).
For a low resolution model, you could use a range of [0,255] and save BYTE positions with a huge saving in file size!
For a higher resolution model, you could use a range of [0,UINT_MAX] and save unsigned int positions.
If the most detailed parts of the model (hands and face in the human) are all near the top of the model, for example, a non-linear mapping could be interpolated so that most of the detail is at the top of the model.
To reconstruct the model, the mapping style, range, scale, origin and orientation would need to be saved as well as the vertex list and triangle/quad indexes into the vertex list.
This page has covered mapping one dimension to another.
Mapping is also used extensively to move, for example, three dimensional world coordinate systems to two dimensional screen systems.
This is done using matrices and can be very time-consuming to program (because you can put mad numbers into the matrices and get results that look OK... for a while).
Fortunately, there are simple ways to go about understanding matrix transformations. On this site, that journey starts with gPlane.


